Download Source code: rtvis_source.zip
Download Executable: rtvis_executable.zip (Windows 11 x64)
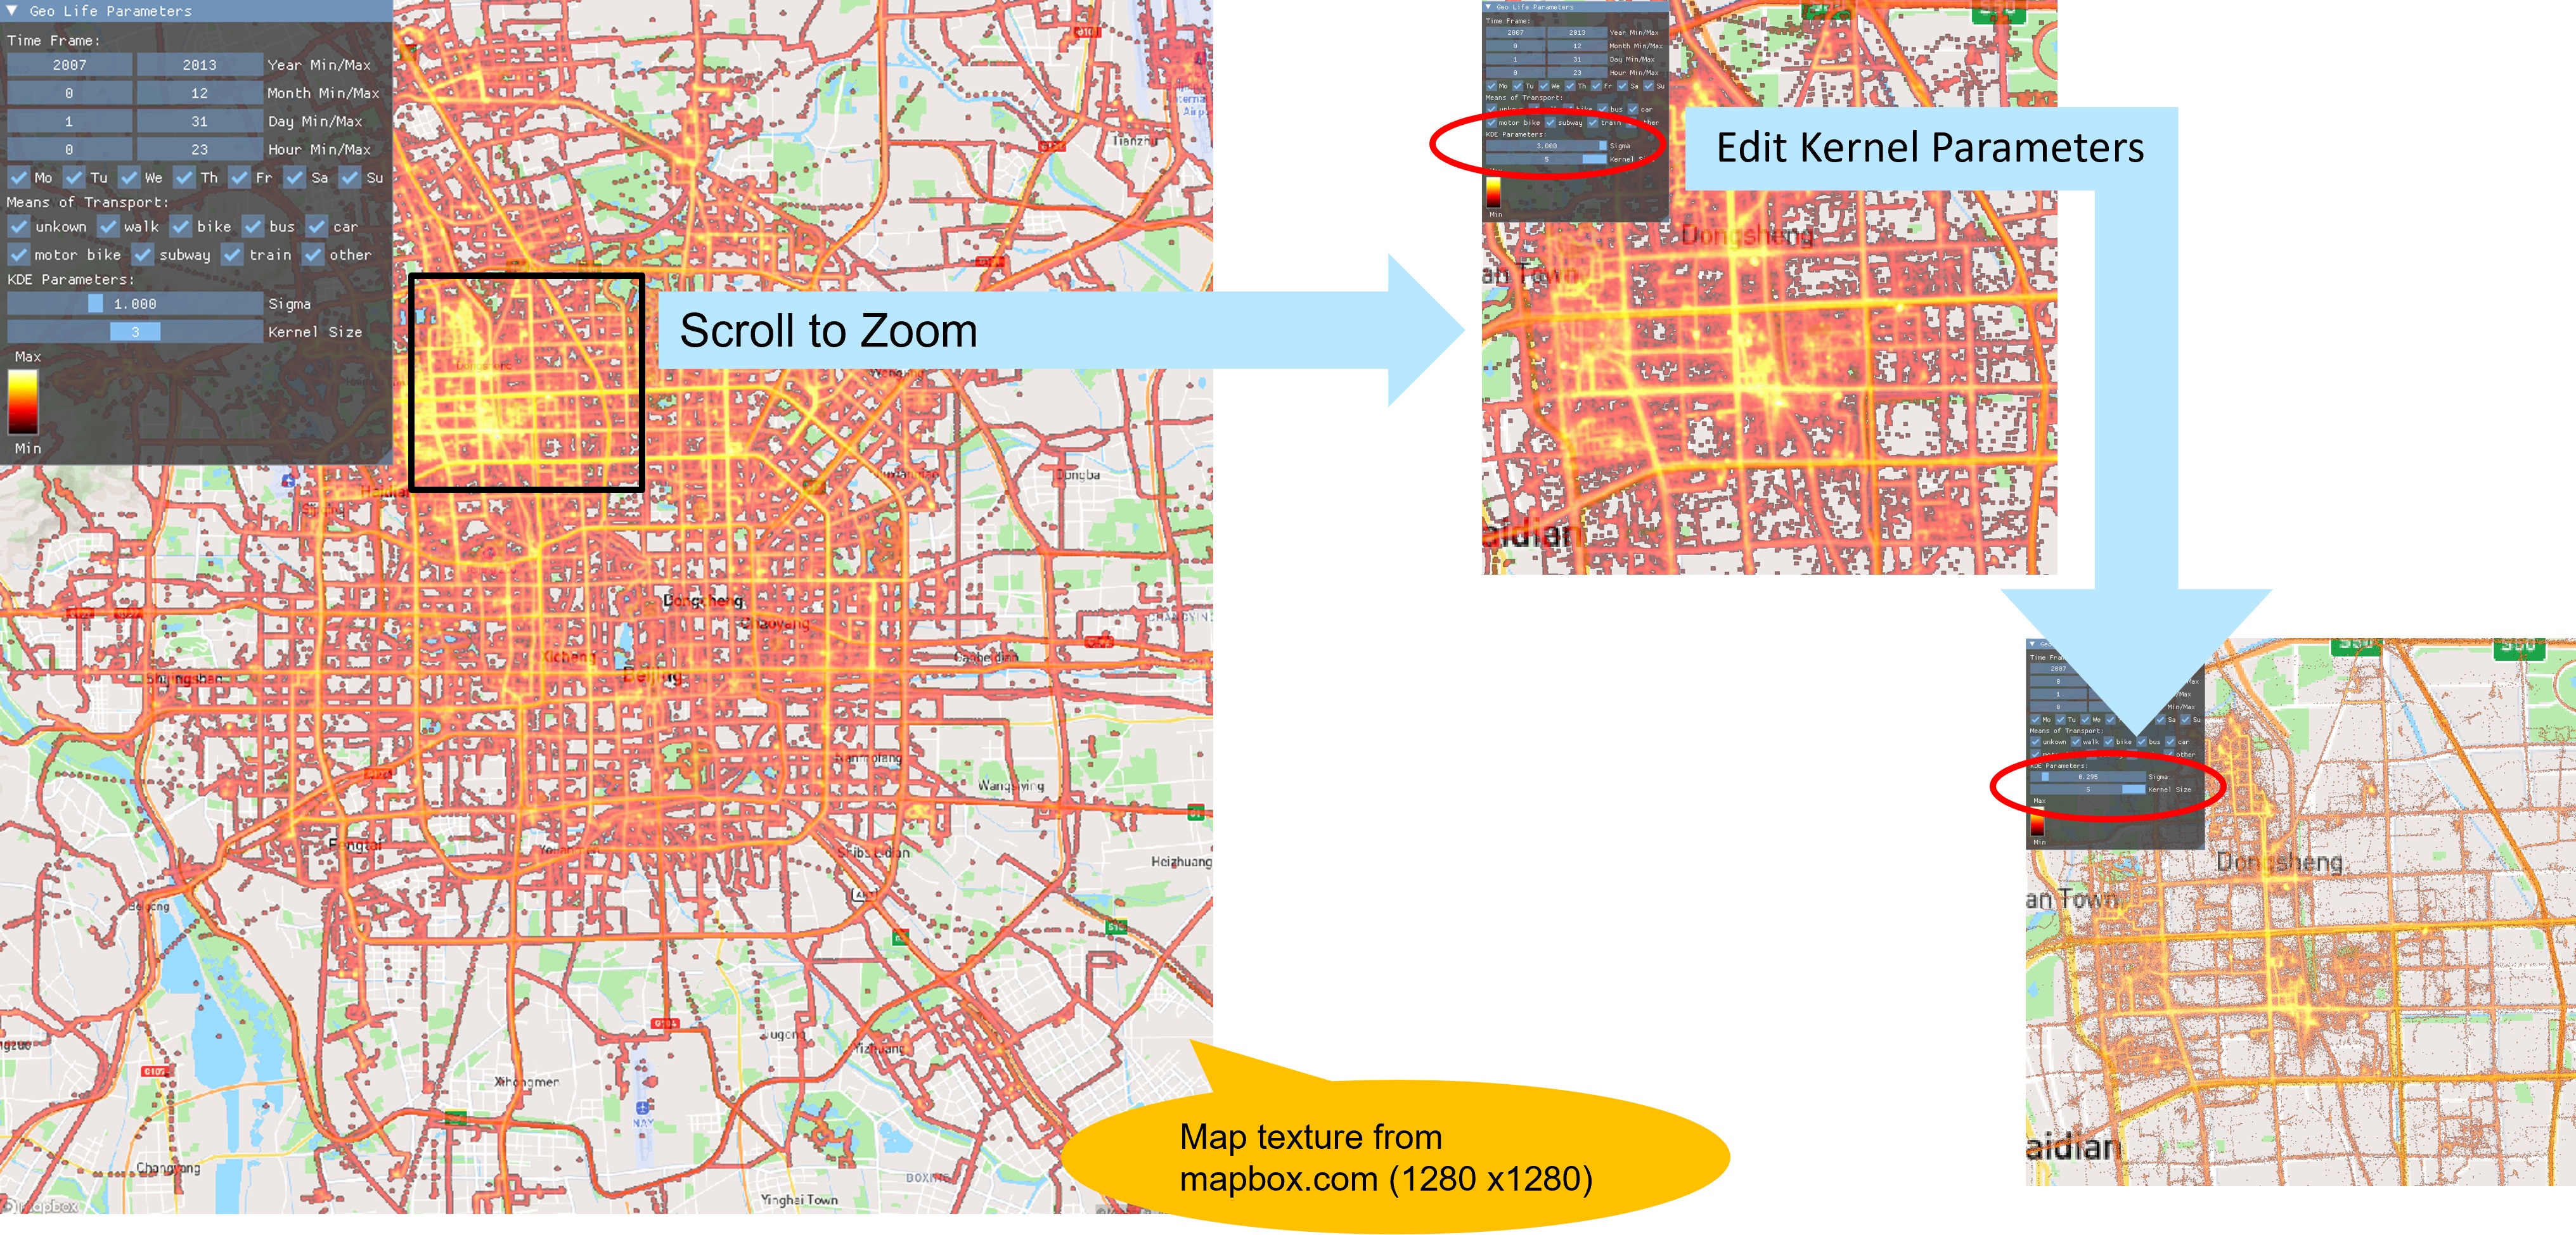
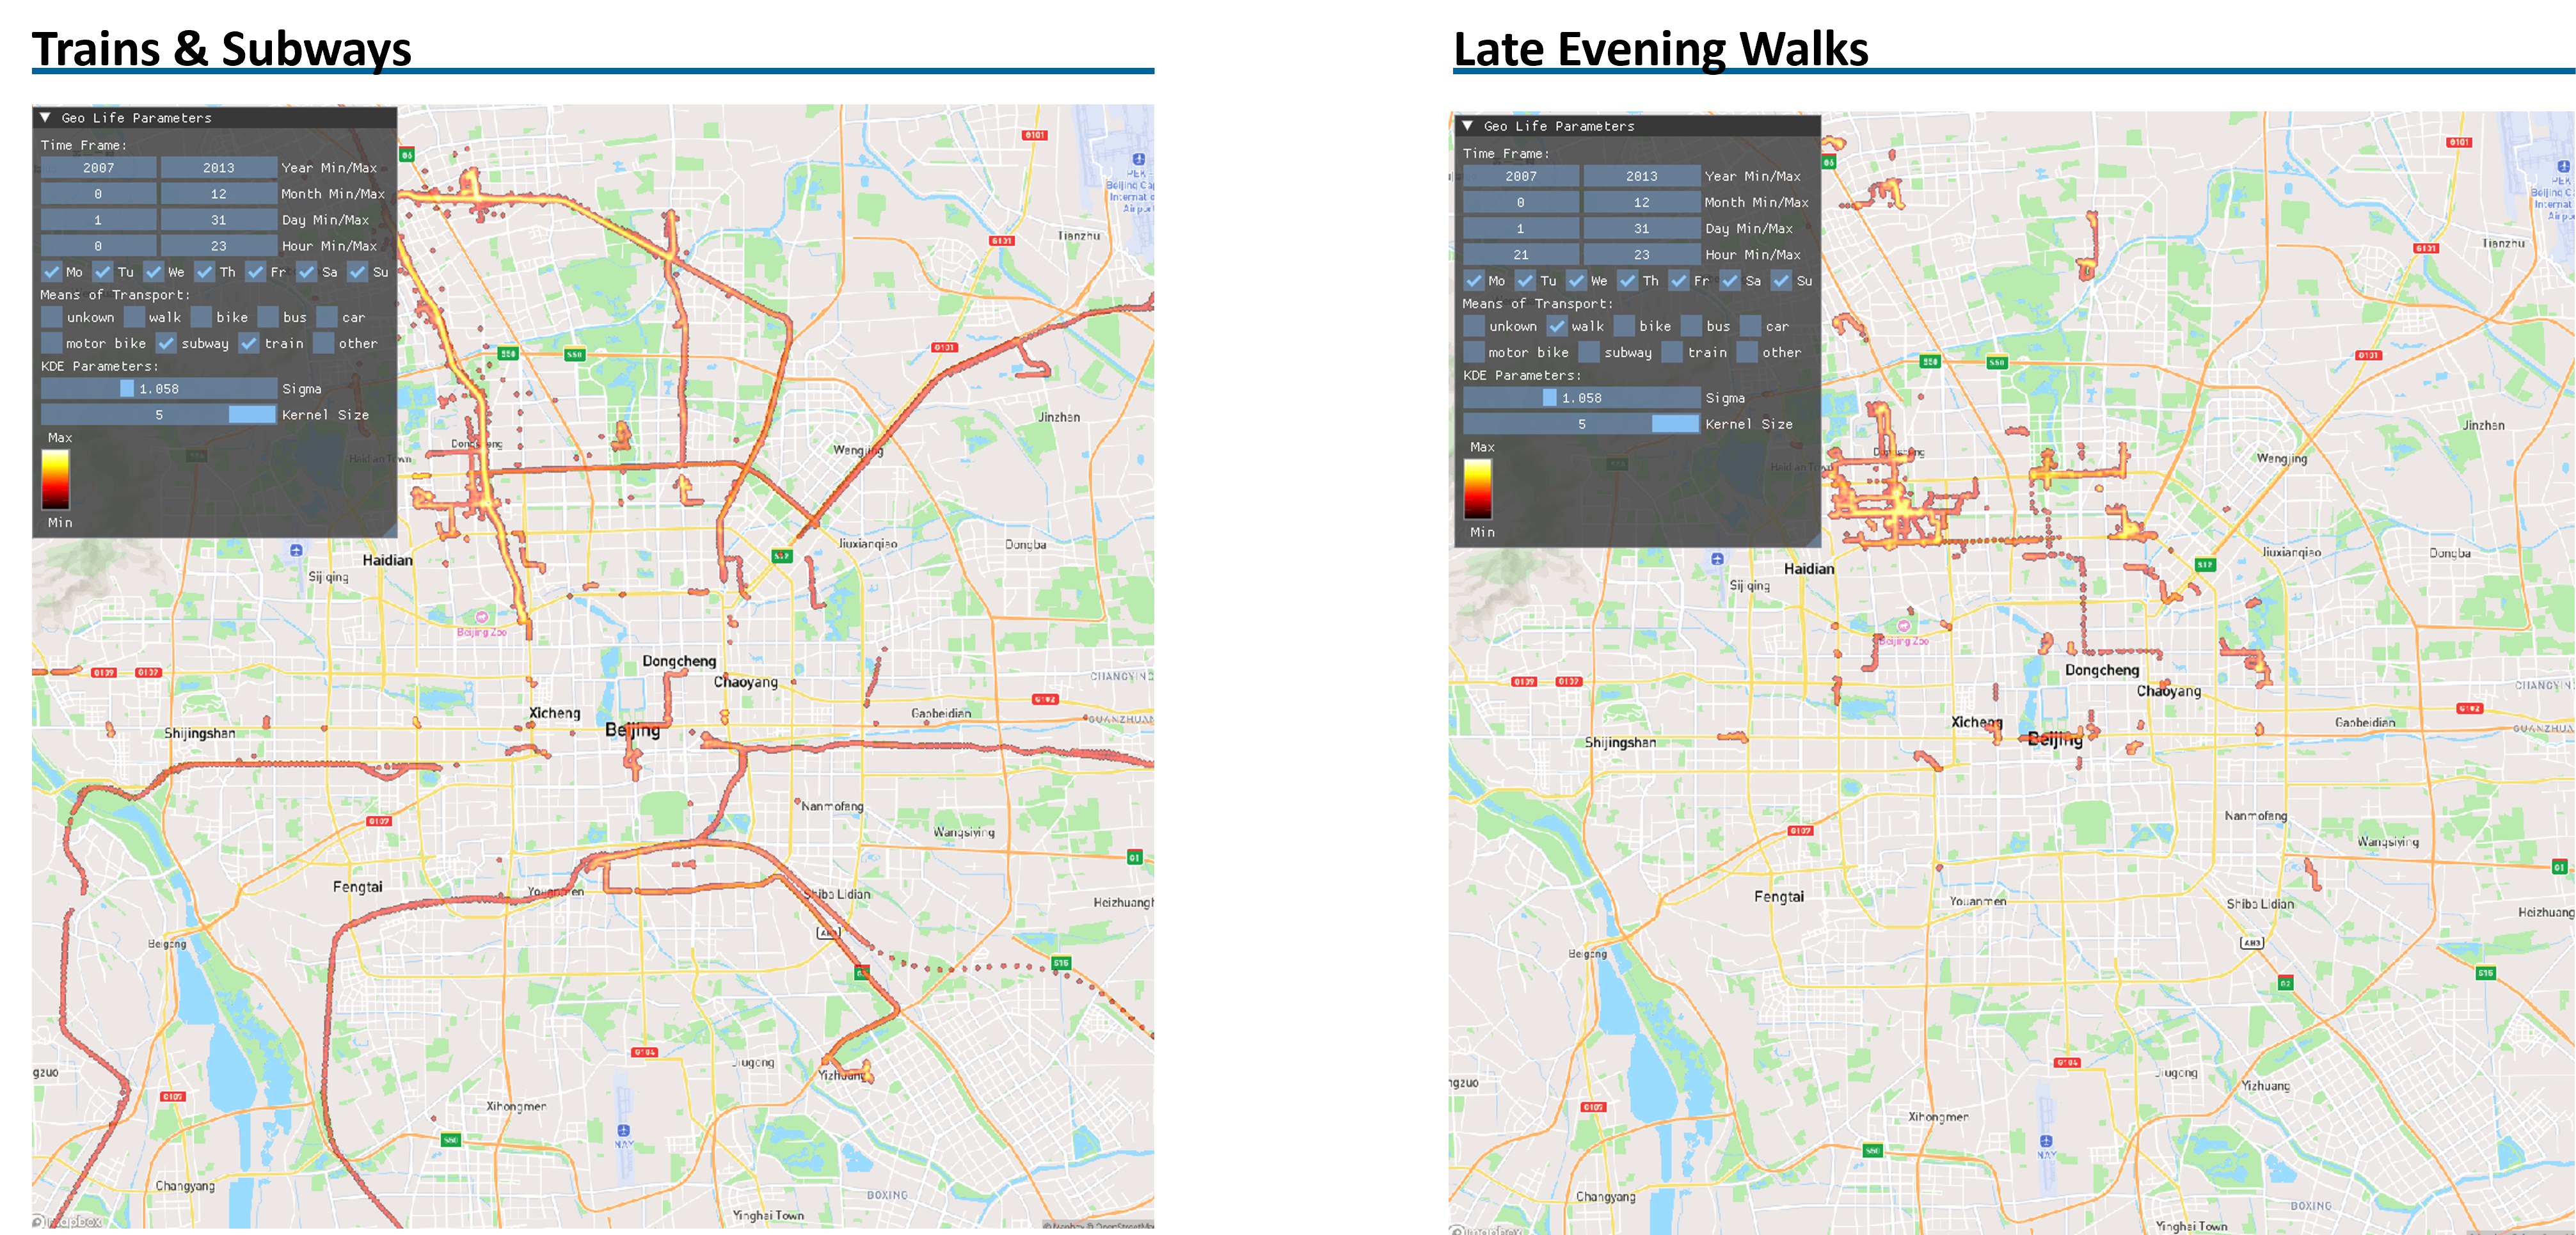
I wrote this visualisation of a large data set with Vulkan for a univesity project. The application visualizes a heatmap of the Geolife data set in Beijing. The data set contains gps trajectories labeled by mode of transport. It comprises a total of over 18 million gps data points which are filtered and displayed in realtime according to the filter settings selected by the user. The data set is stored in a ssbo. A compute shader filters the data on demand and applies a kernel density estimation to create a heatmap which is used as an overlay by the fragment shader. Filters can be modfied through an ImGui panel by the user.